Somewhere in Insights / Reports: Show the average amount of days deals spend in each stage.


I'm talking about information in the image above, but for all deals in a pipeline, as a table. As far as I understand this is only available to see in Reports > Deal velocity > by Stage in "Average days in the stage", but for some reason it only shows information for "closed" deals.
Our startup is in B2B and only has a couple of paying clients, so for us it's much more valuable to see how long it takes for deals to go through each stage to identify bottlenecks.
0
Answers
-
Thanks for sharing @Дмитрий Д
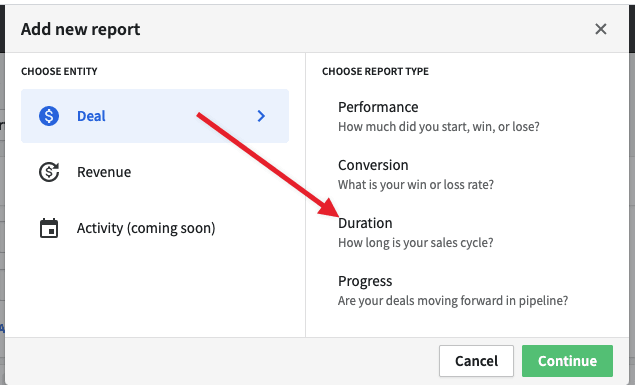
This is actually possible already in the Insights reporting. If you start a new report you can pick this one:
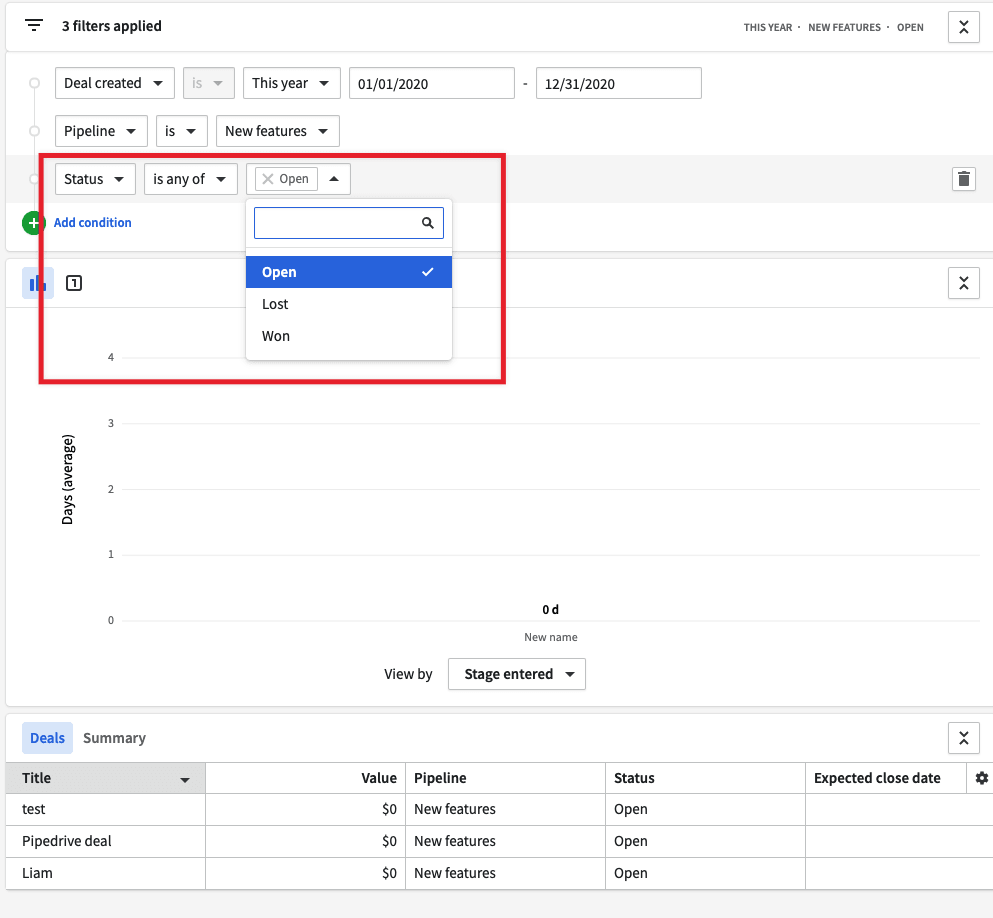
Then you can also pick the timeframe, pipeline, etc.. And it's also possible to select what deals you are seeing, open ones as well:
0


This discussion has been closed.